Coffee & Viz - Dr. Christopher Healey, Computer Science: Understanding Color for Data Visualization
Friday, February 20, 2015
9:15am to 10:30am
This event is part of the Coffee and Viz event series.

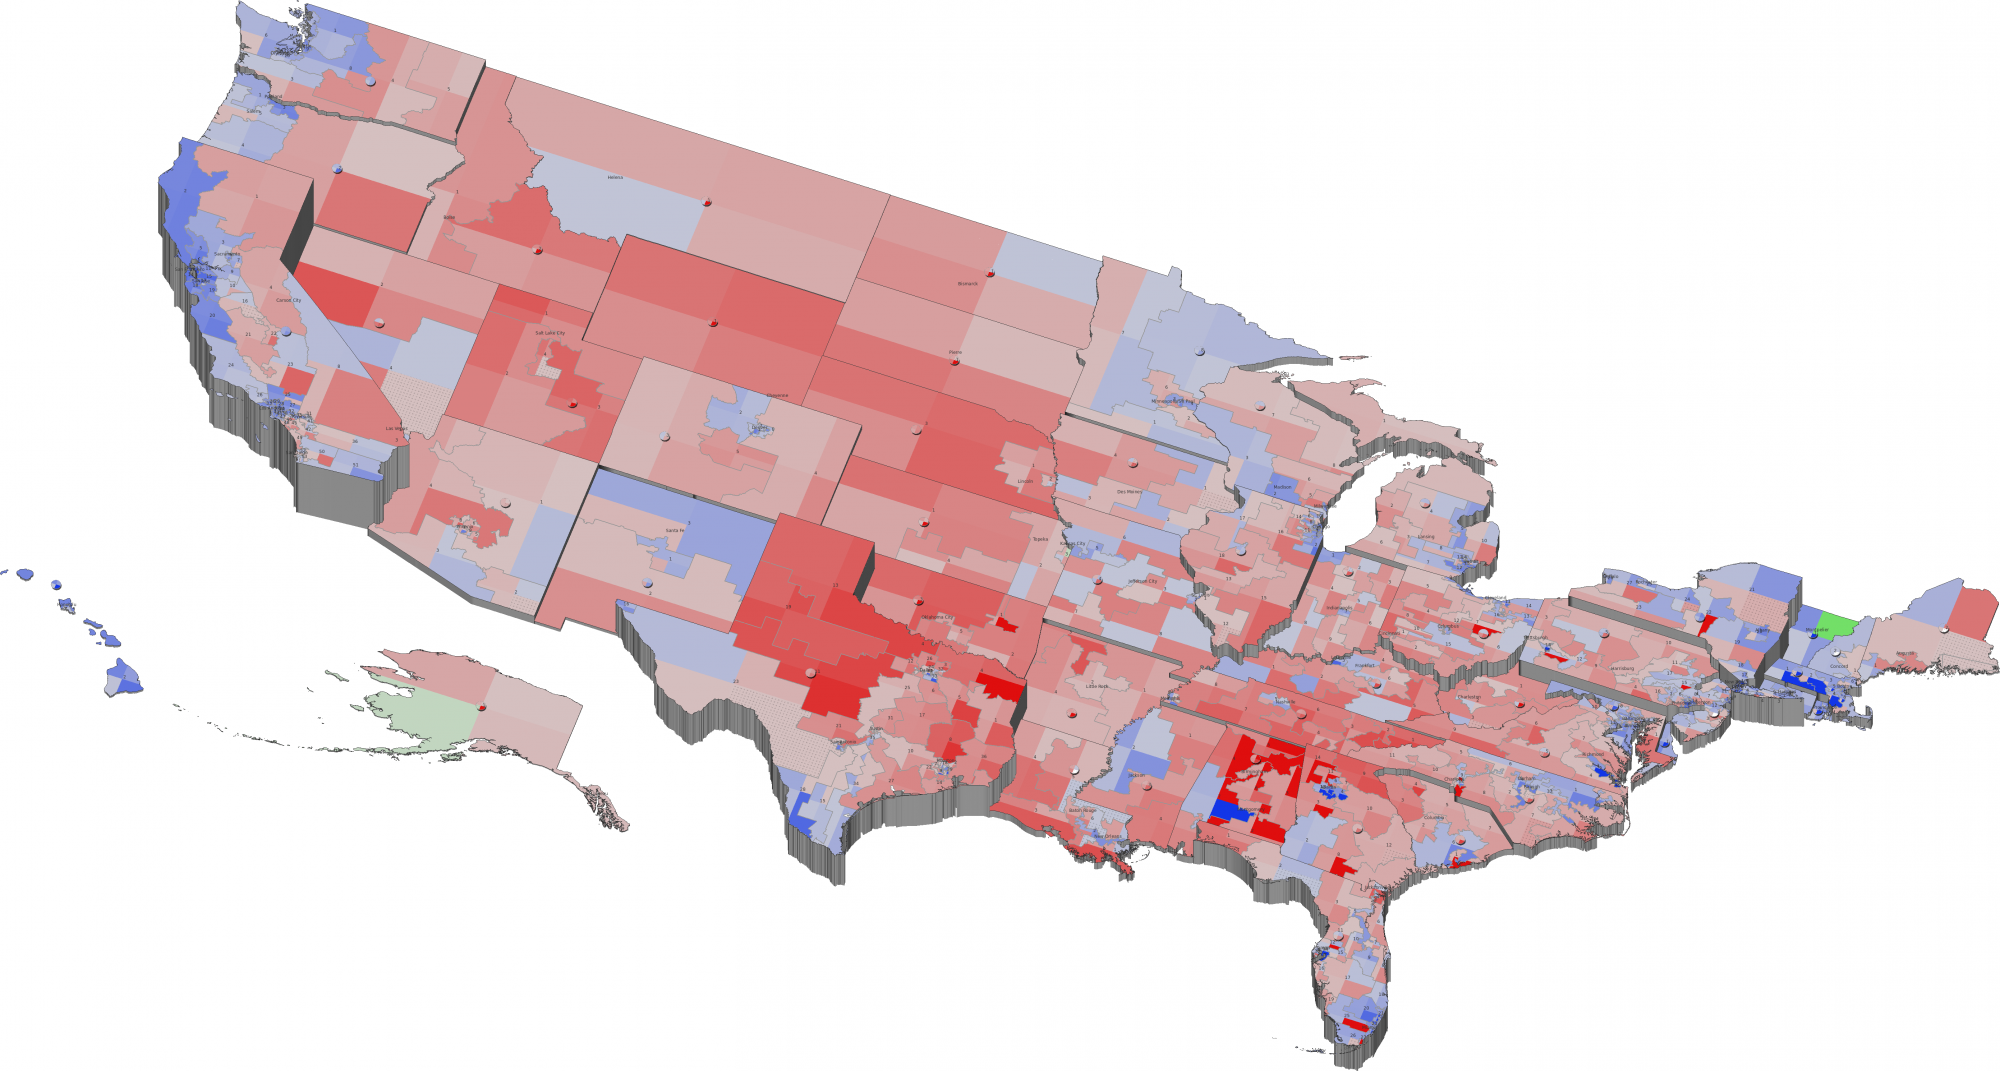
Visualization of recent U.S. election results.
When
Friday, February 20, 20159:15am to 10:30am
Where
Teaching and Visualization Lab, Hunt LibraryAbout This Event
Introducing the Coffee & Viz seminar series. Held in one of the NCSU Libraries high-tech spaces, Coffee & Viz is a forum in which NC State researchers share their visualization work and discuss topics of interest. All Coffee & Viz programs are free and open to the public and are presented by the NCSU Libraries. Coffee and light refreshments will be available in a nearby space at 9:15 a.m., program begins at 9:30 a.m.
Dr. Christopher Healey’s work harnesses visual perception to create visualization techniques supporting the rapid and effective exploration and analysis of large, complex datasets. "Colour is a familiar concept that we all recognize and use in our day-to-day lives. Understanding how colour 'works' is a much more fascinating problem, however, involving the physics of light, visual perception, language and culture, and context. This talk will touch on these issues by discussing them and demonstrating how they affect presenting data with colour. As a practical example, I will show how we used colour to visualize results from the recent 2014 U.S. elections."
Biography
Christopher G. Healey is a Professor in the Department of Computer Science at North Carolina State University. He also teaches at the Institute for Advanced Analytics. He received a B.Math from the University of Waterloo in Waterloo, Canada, and an M.Sc. and Ph.D. from the University of British Columbia in Vancouver, Canada. He is an Associate Editor for ACM Transactions on Applied Perception. His research interests include visualization, graphics, visual perception, and areas of applied mathematics, databases, artificial intelligence, and aesthetics related to visual analysis and data management.
Abstracts
The following are short abstracts from Dr. Healey on active projects he will discuss at Coffee & Viz.
NFL Play-by-Play Visualization
The National Football League is the largest professional American Football league. The goal of the game is to score points by advancing an oval-shaped ball (the football) towards the opponent's end zone by carrying it (a rushing play), throwing it (a passing play), or kicking it. A description of the game's rules are available from Wikipedia, or from nfl.com. We decided to convert the NFL's play-by-play text into a visualization of the plays within a particular game. In order to do this, we had to solve two problems. First, we need to parse the play-by-play text into a format that unambiguously describes each play. Second, we must to convert the play-by-play descriptions into an effective visual representation.
Ensemble Visualization
Interest in ensembles of simulations has increased rapidly in recent years as scientists from various domains use them to assist in their research. An ensemble is a set of results collected from a series of runs of a simulation or an experiment. Ensembles are normally temporal, spatial and contain multiple attribute values at each sample location, making them difficult to analyze or visualize. Techniques have been proposed to provide better insight for a small number of ensemble members, or to present an overview of the entire ensemble but without maintaining fine-grained details. In this paper, we design and implement a system to combine these two directions of ensemble analysis, providing a scalable approach to facilitate analytics of large ensembles and pattern discovery in both the space and the time dimensions. We implemented a stand-alone system, integrating both static and temporal techniques to support interactive and scalable ensemble analysis and visualization. We exemplified our techniques using a relativistic heavy ion collision (RHIC) ensemble, collected by our physics collaborators at Duke University.
Tweet Sentient Visualization
This project studies ways to estimate and visualize sentiment for short, incomplete text snippets. Sentiment is defined as "an attitude, thought, or judgment prompted by feeling." We are currently focused on visualizing the sentiment of tweets posted on Twitter, an online social network that allows users to upload short text messages—tweets—of up to 140 characters. Our specific goal is a visualization that presents basic emotional properties embodied in the text, together with a measure of the confidence in our estimates.
Election Visualizations
Our interest during this project is to study how groups of individuals vote for different elected offices. Although it is common to refer to a state as "red" or "blue", very few states fit this simple dichotomy. In order to investigate voting patterns across the United States, we decided to visualize winning candidates for four elected offices: the 2012 Presidential, most recent U.S. Senate, 2014 U.S. House, and most recent state Governor's elections. Results were tabulated by congressional district: for each of the 435 districts spread throughout the 50 United States, we visualized which party's candidate the district's voters selected for each of the four offices, as well as state-wide results and incumbent party losses.
Contact Information
Admission
All Coffee & Viz programs are free and open to the public.